View Data Tutorial
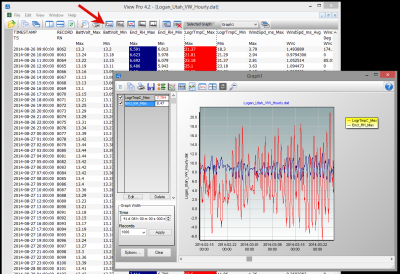
View Collected Data Graphically
Related Videos
- CR300 and CR310 Getting Started Tutorial
- Collect Data Tutorial
- CR1000X Series Getting Started
- Overview and Software Setup (QuickStart Part 1) (5:24)
- CR6 Getting Started Tutorial
- Programming with Short Cut (QuickStart Part 2) (5:49)
- Datalogger Programming
- Use LoggerNet to Send a Program and Collect Data (QuickStart Part 3) (5:06)
- Use PC200W to Send a Program and Collect Data (QuickStart Part 4) (3:44)
Learn more about CampbellCloud.