Implementation of the Spectral-Analysis Technique Applying spectral analysis to read vibrating wire sensors

Implementation of the Spectral-Analysis Technique
The usefulness of spectral analysis to read vibrating wire sensors depends on its suitability for field use. The device must be cost effective, rugged, low power, and easily integrated with existing data acquisition equipment.
Campbell Scientific, a data acquisition company based in Logan, Utah, previously developed time-domain methods to read vibrating wire sensors. Armed with this experience, instrumentation engineers at Campbell Scientific developed a new vibrating wire readout module that incorporates spectral analysis. This new module, the AVW200, excites the sensor's wire, samples the response, applies the Fourier transform, and returns the measurement result and diagnostics to the data logger—all within two seconds.
The AVW200 and its wireless counterpart, the AVW206, have been available since early in 2008. Since then, they have been successfully used in a number of applications. The following sections describe how the new technology benefited two large bridge projects: the widening of the Huey P. Long Bridge in Louisiana and the reconstruction of the I-35 St. Anthony Falls Bridge in Minnesota. *These projects were originally published as case studies on our website, and the projects may be in various stages of completion since that time.
Case Study: Huey P. Long Bridge Widening Project
The four main spans of the Huey P. Long Bridge extend nearly 2,400 ft over the Mississippi River in New Orleans, Louisiana.

This cantilevered steel through-truss bridge opened to traffic in 1935 and is owned and operated by the New Orleans Public Belt Railroad. The bridge currently carries dual rail lines between the trusses and two lanes of vehicular traffic cantilevered to the exterior of each truss. Based on the need to improve vehicular traffic flow and constraints due to uninterruptible rail traffic, the Louisiana Department of Transportation and Development (LA DOTD) decided to widen the bridge rather than replace it.
The bridge widening will facilitate an increase in roadway width on each side of the bridge from its current width of 18 ft to 40 ft. The widening will entail the addition of upstream and downstream trusses parallel to the existing truss. The bridge piers are being modified with additional concrete encasements and steel frame to support the two new widening trusses.

A structural health-monitoring program is included in the construction contract as a proactive measure to assess whether the anticipated amount of load is being transferred from the widening truss members to the existing truss members.
CTLGroup was awarded the contract to design and install the truss-monitoring system according to the specifications for the Huey P. Long Bridge widening project. The truss-monitoring specification required the following:
- Determination of initial dead-load stresses in existing eyebar members
- Installation of strain gages for measurement of construction-related stresses in 433 members
- Installation of strain gages for measurement of live-load stresses in 31 members
- Installation of biaxial tilt meters on each of the five existing bridge piers
- Monitoring system to read the gages, make comparisons with predicted values, and provide daily reports throughout the three-year construction process
- Performing load testing to calibrate the monitoring systems
A total of 433 existing truss members are monitored with an array of 827 static and dynamic strain gages designed to measure axial and bending load effects. In addition, tilt meters monitor the inclination of the piers. For the static system, CTLGroup chose vibrating wire strain gages based on cost, built-in temperature compensation, and the ability to run long distances with lead wires.
The truss-monitoring data acquisition system is composed of two separate monitoring systems: a static-load monitoring system and a live-load monitoring system, as shown in Figure 12.

The static system uses 23 track-side-mounted NEMA enclosures that contain AM16/32 multiplexers to read 777 vibrating wire sensors on 433 members. In addition, five piers were monitored using ten vibrating wire tilt meters as well as ambient temperature, wind speed, and wind direction. Because of the need for wireless communication between multiplexers, data loggers, and the central computer, the system was configured using a combination of 24 AVW206 modules and RF401 spread-spectrum radios. The multiplexers read the sensors, perform the signal processing, and transmit the data wirelessly to one of four CR1000 dataloggers mounted on the track-side handrail. These data loggers then transmit the data wirelessly to the MTI office trailer approximately one-fourth mile from the bridge site.
The purpose of the system is to measure stresses (strains) in identified members and compare them with predicted response during the bridge-widening construction process. This is accomplished by:
- Establishing limits for predicted response for staged construction
- Accounting for baseline fluctuations (traffic/locomotive loads and temperature effects)
- Comparing measured with predicted response
- Automated flagging of limits outside of predicted response
The system runs continuously and collects data approximately once every ten minutes. It posts the data to a password-protected website. The website visually flags (by color) data that are outside predetermined limits.
With hundreds of vibrating wire sensors involved, this monitoring project provided an appropriate setting to apply the new spectral-analysis method. The outcome was very positive. Historically, an application with so many vibrating wire measurements would require extra effort to validate measurements and identify noise-compromised data. Typically, some data would be lost due to noise interference. In this case, however, spectral analysis eliminated noise issues. No data were lost, and no extra effort was needed to identify noise-compromised data.
The diagnostics provided by the new method also proved to be beneficial and were used extensively throughout the project. CTLGroup reported that troubleshooting issues could not have been as easily resolved without the AVW206. Though they have previously used time-domain solutions, this experience has put them solidly behind the spectral-analysis method.
For more information, refer to the "Louisiana: Monitoring Bridge Expansion" case study.
Case Study: St. Anthony Falls Bridge Foundation Monitoring
On August 1, 2007, the I-35W St. Anthony Falls Bridge over the Mississippi River in Minneapolis, Minnesota, collapsed in the middle of rush hour.

(Photo courtesy of Mike Wills)
The collapse killed 13 people and opened the eyes of policymakers and engineers alike to the serious nature of America’s failing infrastructure. A tremendously cooperative effort to quickly and safely replace the bridge resulted. It harnessed today’s technologies and continues to provide insight into bridge performance and long-term health. To that end, a program was instituted to show how internal instrumentation could be used to increase quality assurance, monitor construction loads, and subsequently show traffic and wind-load effects on the long-term pier performance.
This was the first part of a larger program involving the entire bridge, and it pertained only to one of the three elevated piers, specifically the Southbound Pier 2 columns and foundations. Therein, two types of strain gages and thermometers were installed to monitor three phases of the bridge and foundation system: (1) internal concrete curing temperature of the foundation elements, (2) construction loads, and (3) long-term health.
Four levels of six strain gages each were installed in two of the eight 100-ft-deep drilled shaft foundation elements (48 gages total). Gage levels were designated to identify load-carrying contributions from various soil layers. These levels were at the top of the shaft (ground surface), top of the soft rock, top of the competent rock, and bottom of the shaft.
Each gage level consisted of four vibrating wire strain gages positioned at quarter points around the circumference of the shaft cross section. Two of the four vibrating wire gages at each level were coupled with a resistive strain gage situated at opposite sides of the shaft. This scheme provided long-term stability with the slower vibrating wire gages along with fast measurements from the resistive gages during dynamic events.
In addition to the foundation measurements, two levels of four vibrating wire strain gages were installed in the two columns supporting the two southbound concrete box girders (16 total vibrating wire gages). The first level was at the mid-height of the columns; the second was at the base of the column. Mid-level gages were duplicated with resistive strain gages for measuring short-duration transient events.
Two separate data acquisition systems were used to measure the vibrating wire and resistive strain gages. The vibrating wire gages were read with the AVW200 and recorded with a CR1000 datalogger, including the vibrating wire internal thermistor recordings. The resistive gages were measured with Campbell Scientific’s CR9000 high-speed data acquisition system. Vibrating wire gages were sampled every two minutes, and the sample period was later slowed to a 15-minute interval. Resistive gages were sampled at 100 Hz; the average, maximum, and minimum values were recorded every 15 minutes. Both systems were self powered with solar panels and deep-cycle batteries, and each system uploaded data to a remote host server using cellular modems. This arrangement allowed the data acquisition systems to operate independently of on-site construction power and communications, and they did not interfere with day-to-day construction activities. Key aspects to both data acquisition systems were remote data monitoring, remote program downloading, and remote reconfiguration as the data acquisition requirements increased and decreased.
Phase 1 involved internal concrete temperature monitoring. The embedded thermistors internal to the vibrating wire strain gages provided one means of assuring that concrete temperatures stayed within acceptable ranges. Figure 14 shows the internal shaft temperature at each of the gage levels over the course of shaft and footing construction.
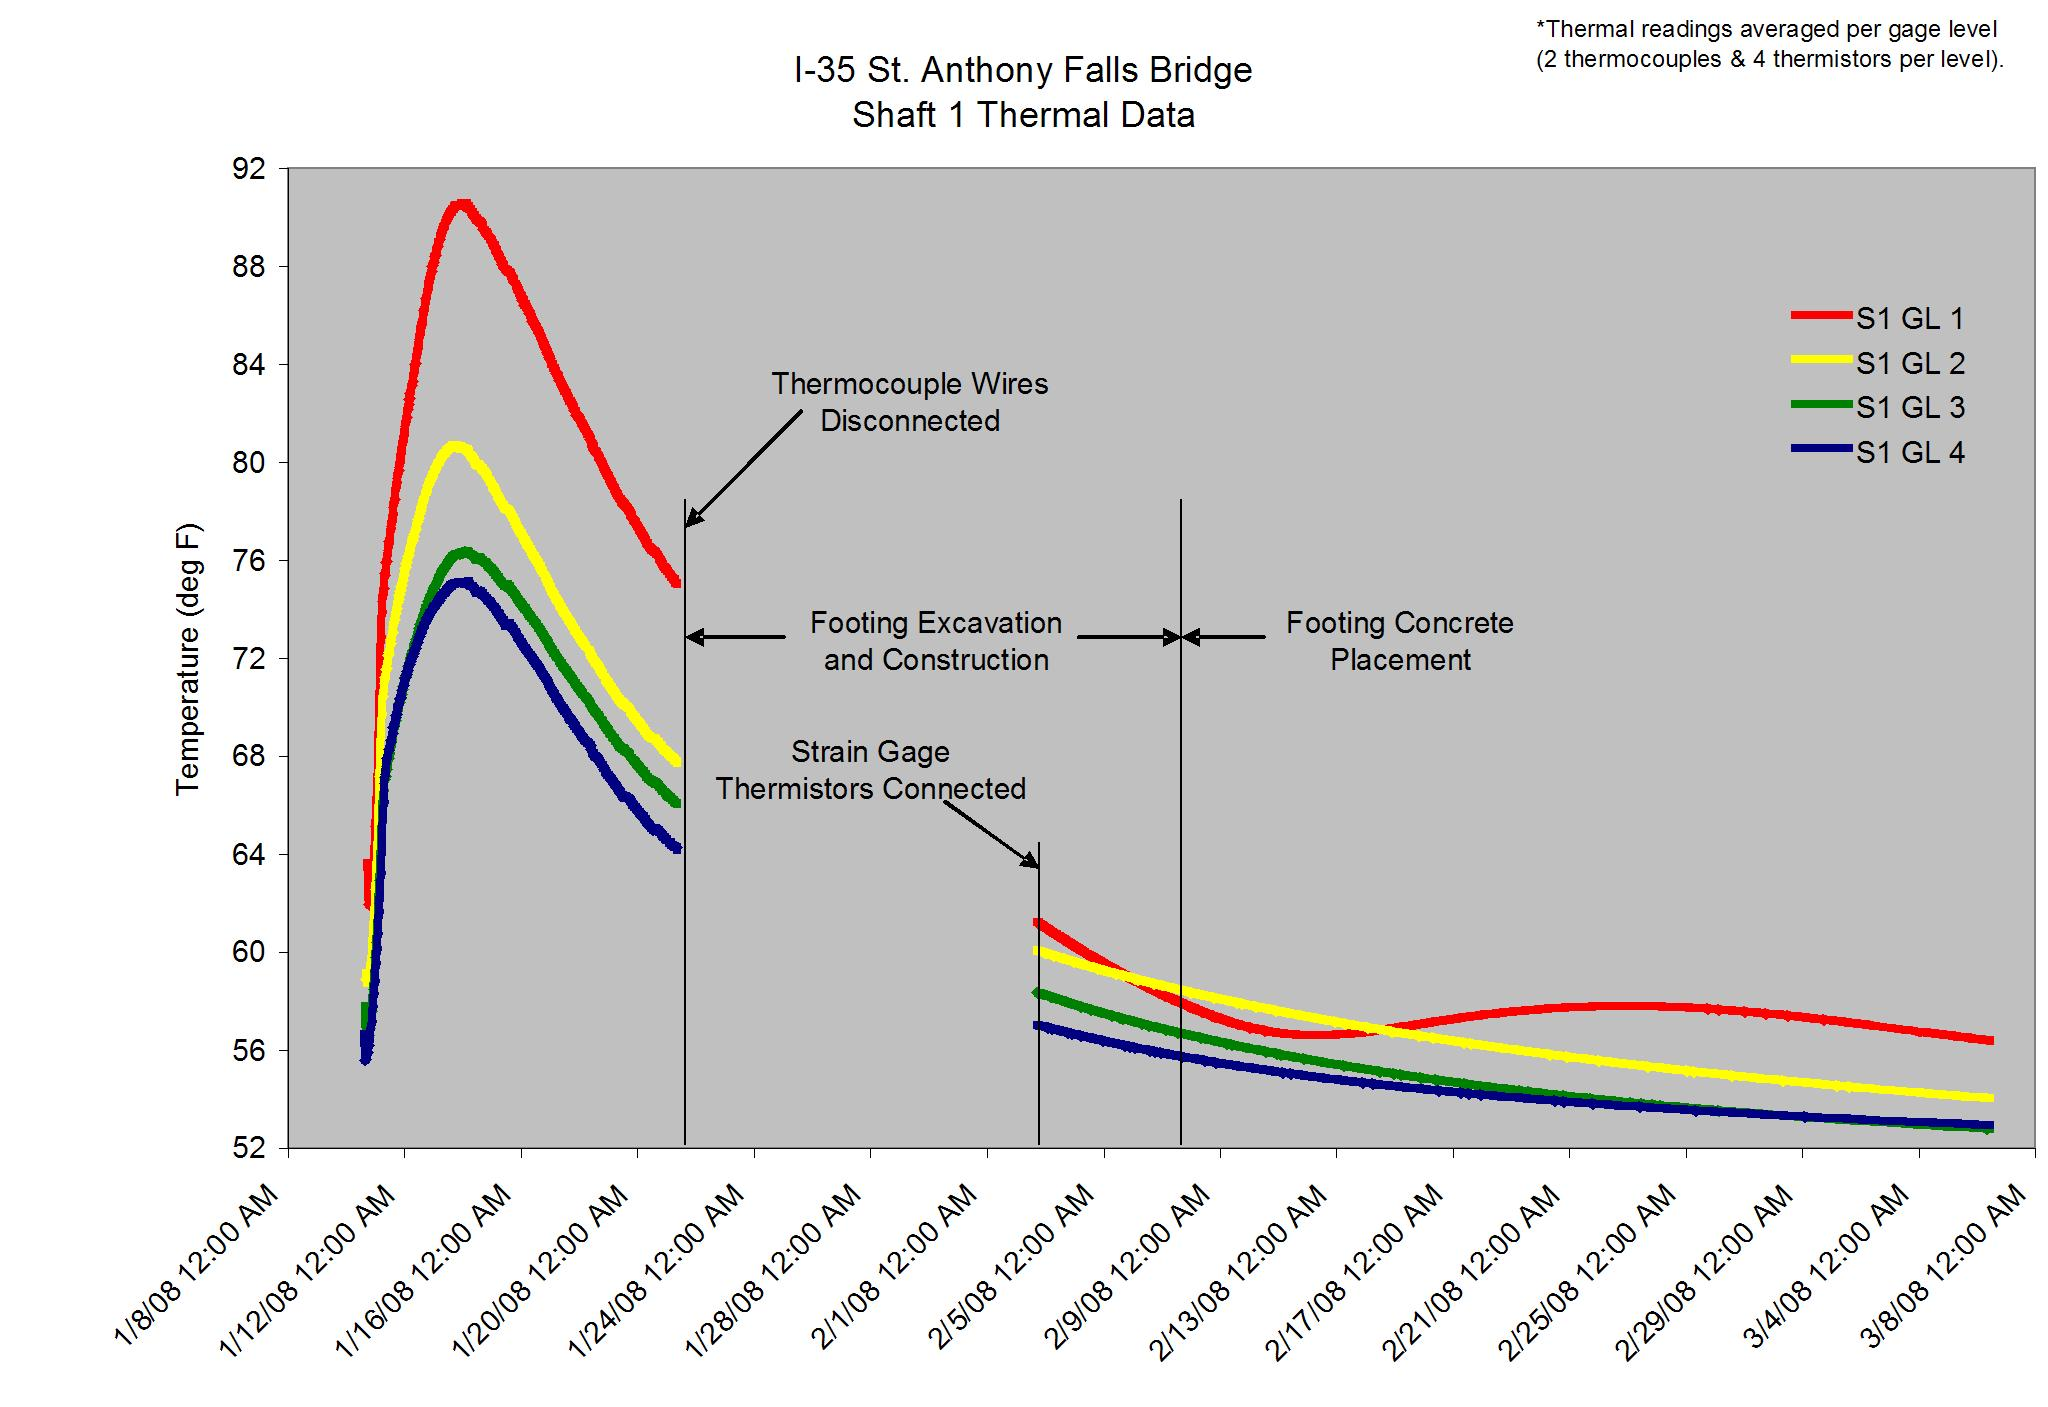
Fig. 14. Internal shaft temperature at the gage levels
Click the graph for a larger image.
Phase 2 monitored increasing loads and how those loads were distributed down the length of the shafts as construction progressed. Figure 15 shows the load on one of the shafts beneath the Pier 2 footing, along with construction milestones. This figure shows that almost 800 kips of the 3500-kip total shaft load was resisted in end bearing and that about half the remaining load was carried by the rock-layer side shear. Load steps are evident between May 29 and July 9, showing the placement of each of the 15 box-girder segments.

Phase 3 is ongoing. It uses the calibrations and correlations derived during Phase 2 to monitor the long-term health of the bridge. Variations in shaft and column loads can identify aberrant conditions and alert officials to take appropriate actions.
This project, as with the Huey P. Long Bridge project, was well suited to demonstrate the benefits of the spectral-analysis method for reading vibrating wire sensors. Not only did this project involve a large number of vibrating wire sensors, but the setup was located five feet from a 1000-KW generator. As before, the outcome was very positive. Even with the large generator nearby, no data were lost due to noise, and no extra analyses were needed to determine if measurements had been compromised by noise. In fact, the raw data were posted automatically to a publicly available website every 15 minutes, without review or qualification. Because of the success of the new method in this project, the program manager already has plans to make it a part of two future bridge-monitoring projects.
For more information, refer to the "Minnesota: Bridge Disaster Recovery" case study.